Alerting
Grafana provides an integrated alerting system that enables users to monitor data sources and receive notifications when specific conditions are met. This system supports real-time monitoring and automated responses to critical events.
Key Features of Grafana Alerting
- Alert Rules – Configure conditions using queries and thresholds to trigger alerts.
- Multi-dimensional Alerting – Supports multiple queries and expressions to create complex alerting conditions.
- Notification Channels – Deliver alerts through various channels, including Slack, Email, PagerDuty, Microsoft Teams, Webhooks, and more.
- Alert States – Alerts can have the following states: Pending, Firing, Normal, No Data, and Error.
- Silencing and Muting – Temporarily disable alerts to reduce noise during planned activities or known issues.
- Grouping and Routing – Organize alerts to avoid duplicate notifications.
Where to Find Configured Alerts in Grafana
To view configured alerts in Grafana:
- Open the Grafana UI.
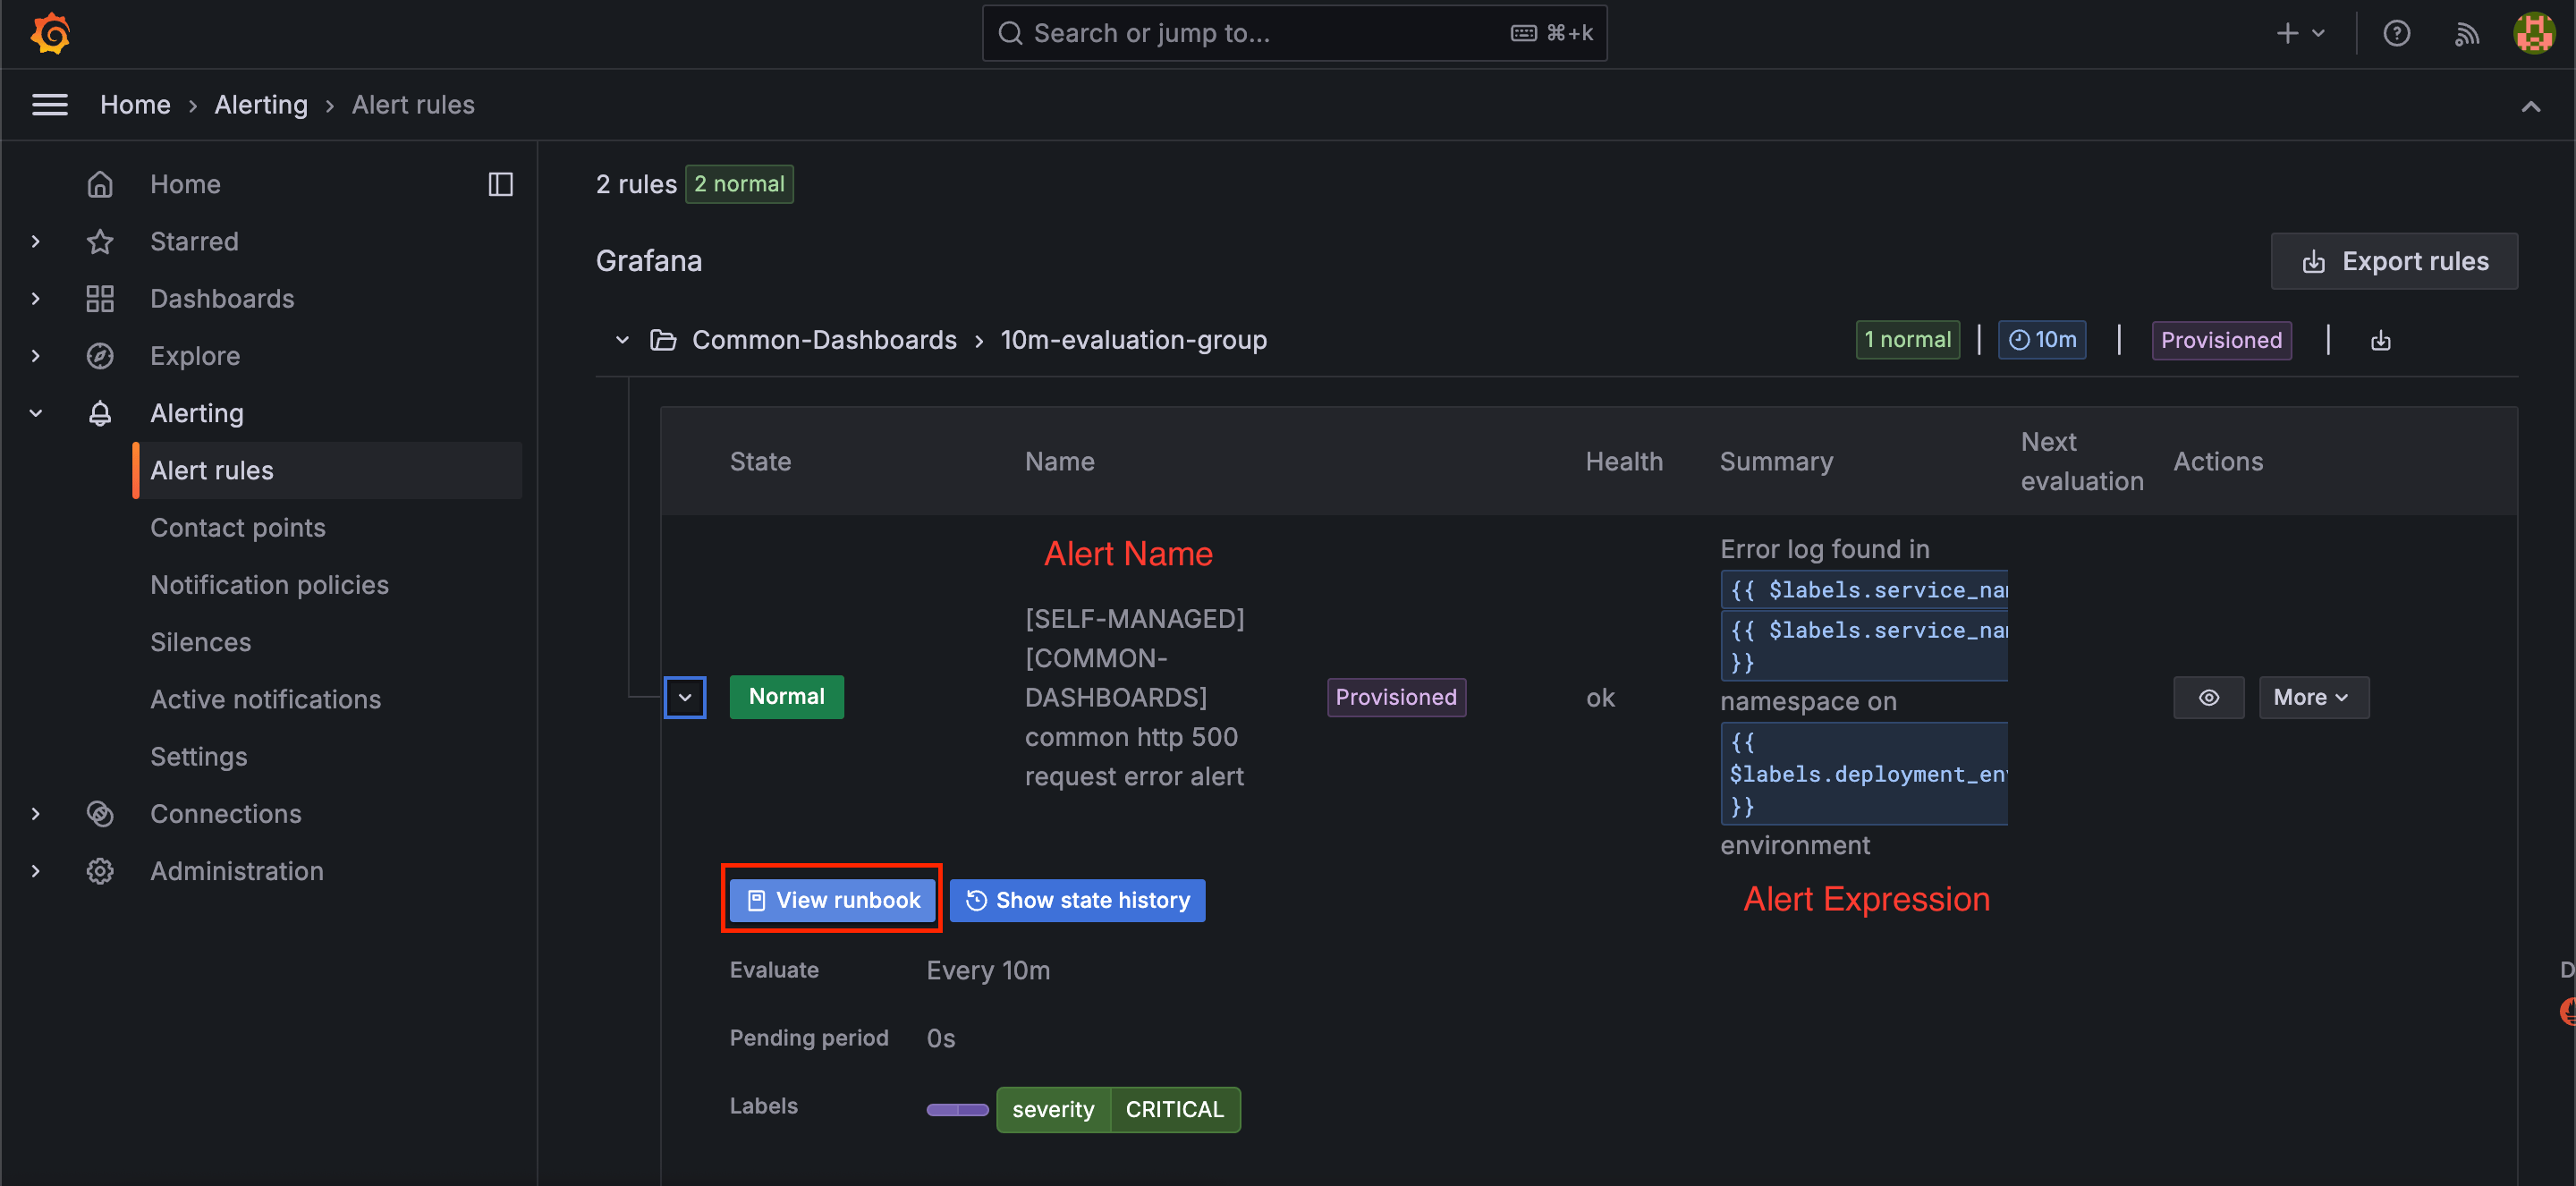
- Navigate to Grafana → Alerting → Alert rules. This section displays all configured alerts along with their current status (e.g., Firing, Pending, Normal)
If an alert is in the firing state, refer to the associated resolution strategy to find the recommended investigation and resolution steps (if available).
Note
- The pre-configured alerts provided by Privacera cannot be modified. To create custom alerts, refer to the Alerting section in Grafana.
- The alerts provisioned by Privacera use the default contact point in Grafana, which is left empty by default. To define a custom contact point, refer to the Configure Custom Alert Contact Points section.
- You can also use default privacera notification templates for alerts and Associate it with a contact point. Refer to Privacera Notification Templates for more details.
- If you wish to create custom notification templates for alerts, refer to Create a notification template and Associate a notification template with a contact point in Grafana documentation.
- Prev Privacera Monitoring