Privacera Monitoring
The Self-Managed version of Privacera supports monitoring and observability of both Privacera applications and the underlying infrastructure. The observability stack collects logs, metrics, traces, and profiles from the Privacera applications and the cluster, offering valuable insights into system health, performance, and reliability.
The diagram below provides a high-level representation of the monitoring tools installed by Privacera. These tools, sourced from the open-source community, can be customized based on specific requirements. See Advanced Configuration for more details.
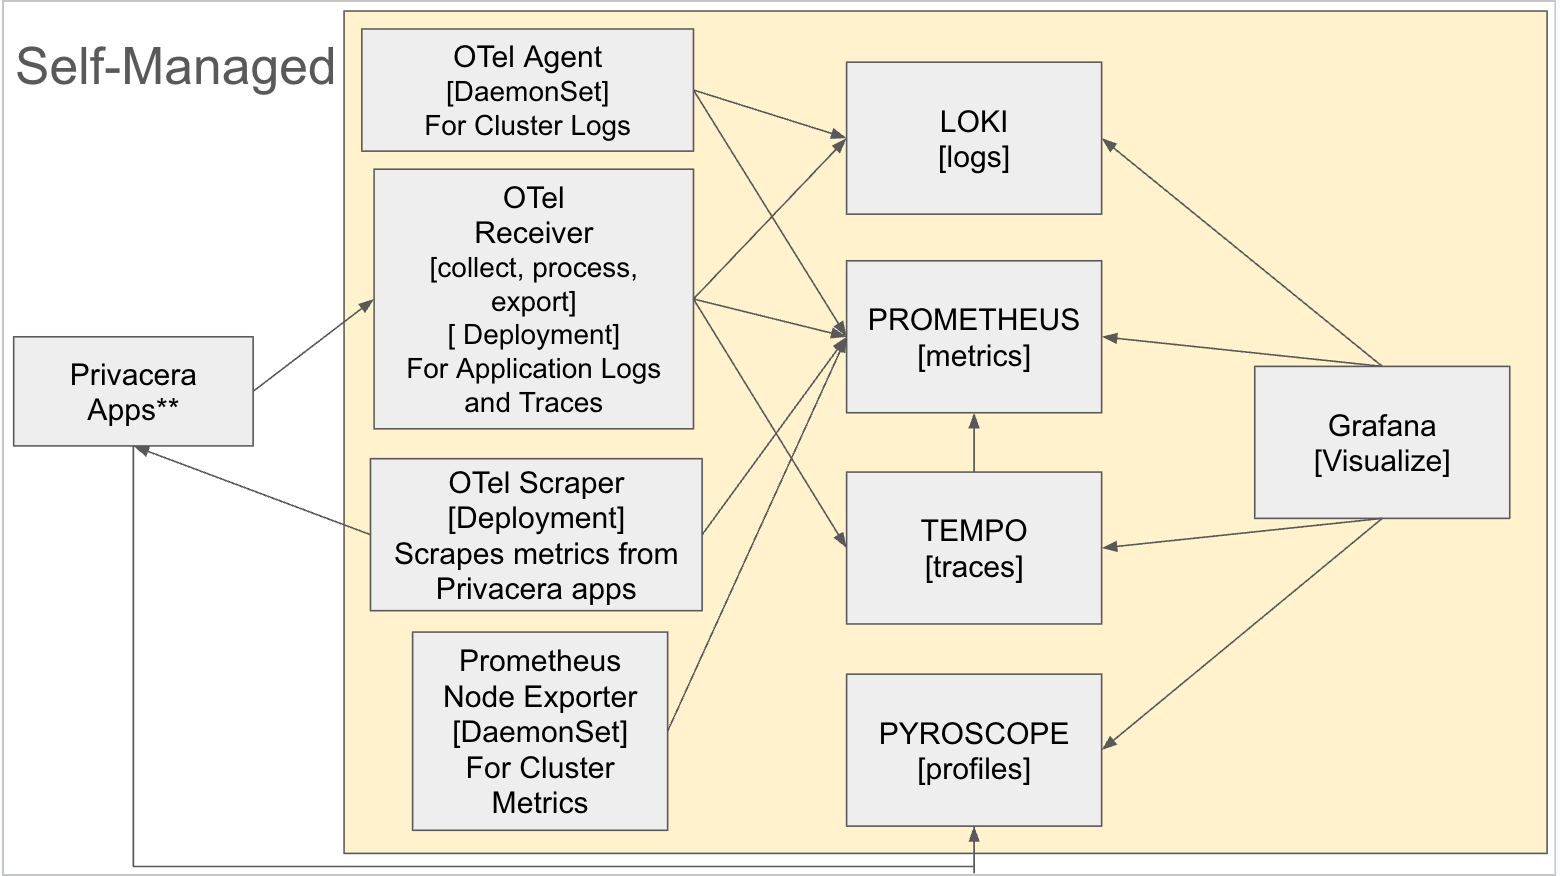
** Not all Privacera applications may provide telemetry data.
Note
By default, Loki, Tempo, and Pyroscope are disabled. To enable these components, follow the instructions in Advanced Configuration.
Components & Workflow
Default Components (Green)
-
OTel Receiver - Centralized Collector - Receives and processes telemetry data from applications.
- Deployment Mode (default): Collects metrics, traces, and profiles from all nodes. Stdout logs only from its own node.
- DaemonSet Mode (Can be enabled via Advanced Configuration): Collects stdout logs from ALL pods cluster-wide. All other telemetry data works identically.
-
PROMETHEUS [metrics] - Time-series database for storing and querying metrics.
- Grafana [Visualize] - Unified dashboard for visualizing logs, metrics, traces, and profiles.
Optional Components (Gray)
- LOKI [logs] - Log aggregation system for storing and querying application logs.
- TEMPO [traces] - Distributed tracing backend for storing and analyzing request traces.
- Prometheus Node Exporter [DaemonSet] - Collects hardware and OS-level metrics from cluster nodes.
- PYROSCOPE [profiles] - Continuous profiling platform for performance analysis.
Data Flow Workflow
To understand how observability data is collected, processed, and visualized, see the workflow diagram below.
graph TD
    subgraph "Step 1: Data Collection"
        A[Applications] -->| Scrapes/Pushes telemetry data| B[OTel Receiver]
    end

    subgraph "Step 2: Processing and Storage"
        B -->|Metrics| P[Prometheus]
        B -->|Logs| L[Loki]
        B -->|Traces| T[Tempo]
        B -->|Profiles| S[Pyroscope]
    end

    subgraph "Step 3: Visualization"
        P --> G[Grafana Dashboard]
        L --> G
        T --> G
        S --> G
    end
This observability stack helps troubleshoot issues, monitor application health, analyze performance bottlenecks, and ensure system reliability.